This site presents results from.
The script zwplots-tim executes the master script ../xwplots to produce various plots of the MHD variables in the heliospheric computational domain.
Firstly, the master script is called to compile the code and compute a demo case. Then, the master script is called to plot the results by the following plot procedures:
The plot procedures can be called with various parameters as described in their headers.
The script zwplots-tim produces the plots given below.
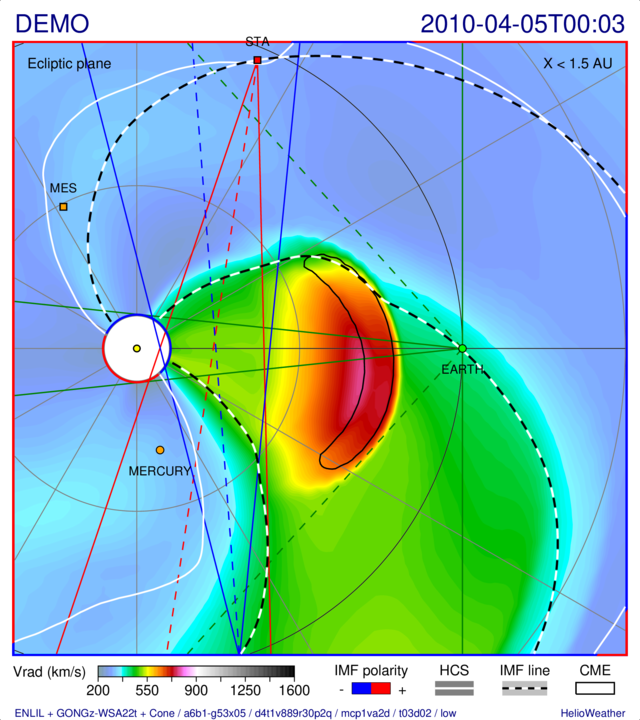
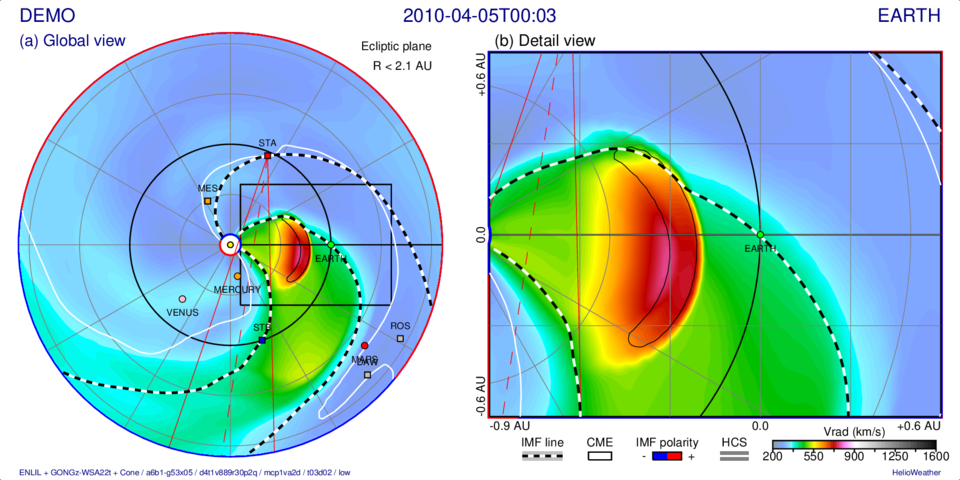
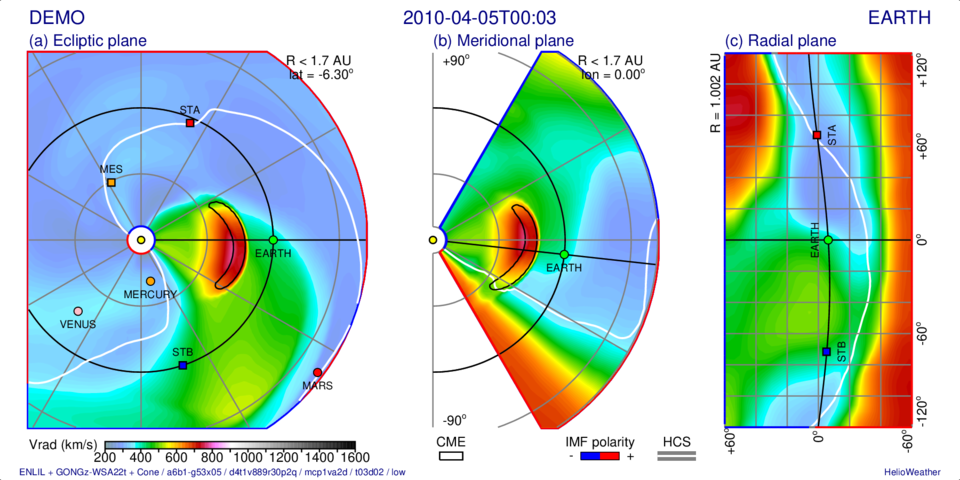
Options: -namslc “vrad1” -rmax 1.7 -zoom 0 (left) Options: -namslc “vrad1” -rmax -1.5 -zoom 2 (right)
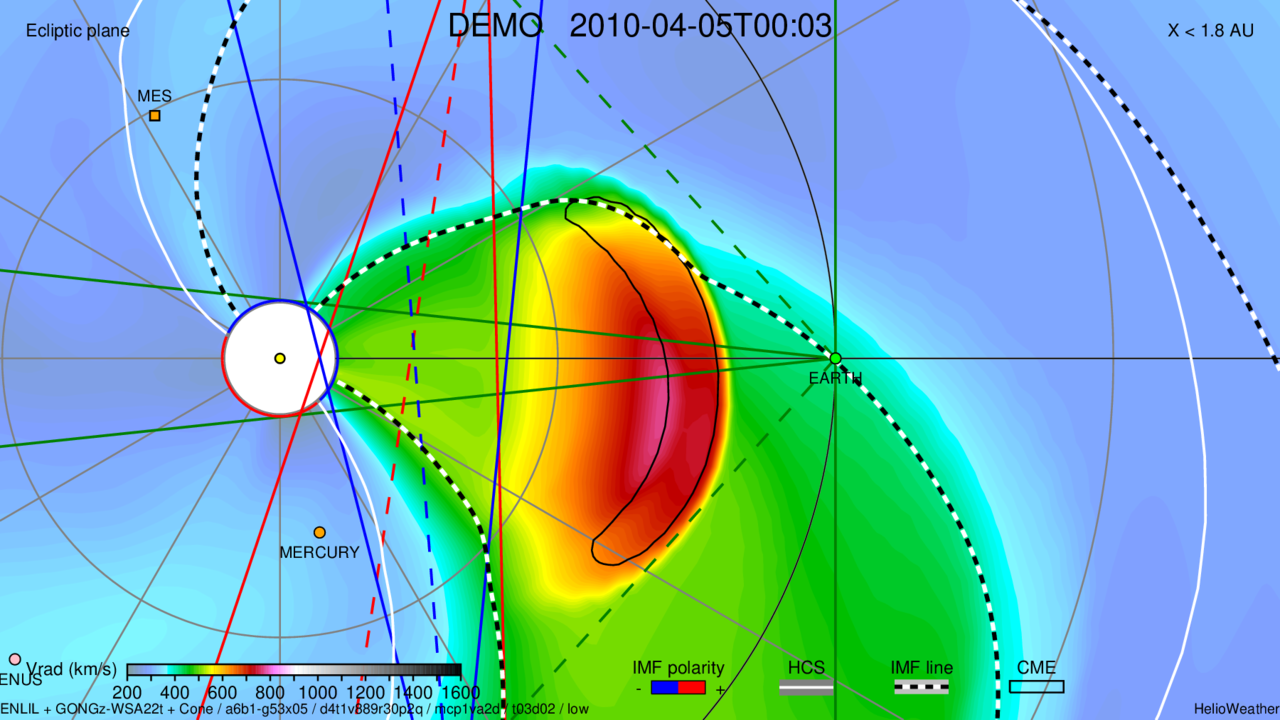
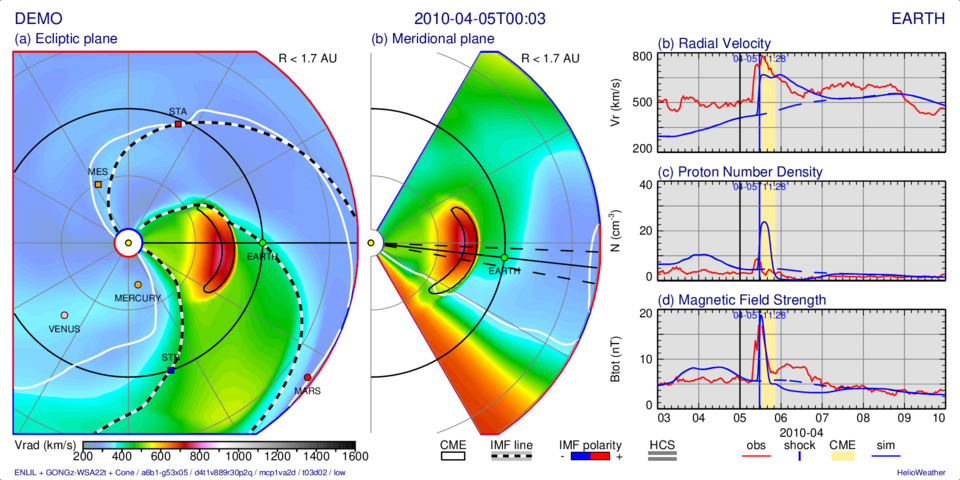
Options: -namslc “vrad1” -rmax -1.8 -wide 1 -zoom 2
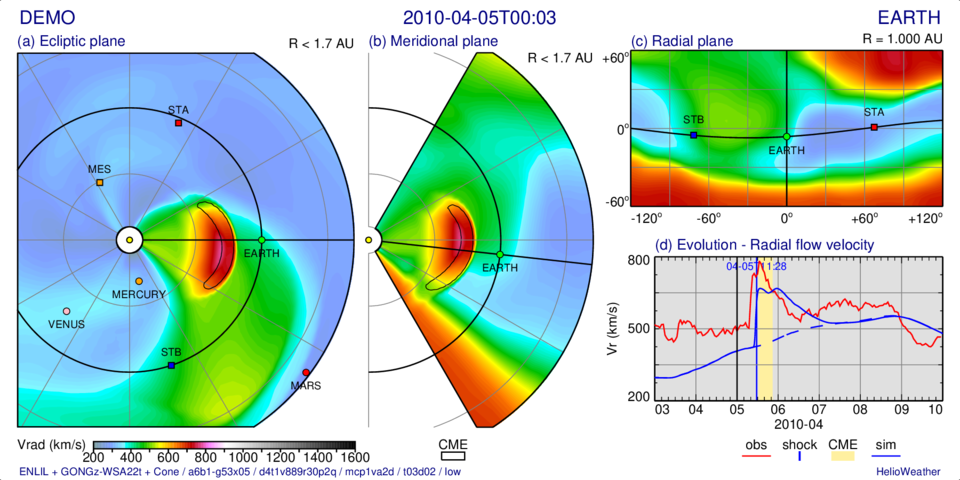
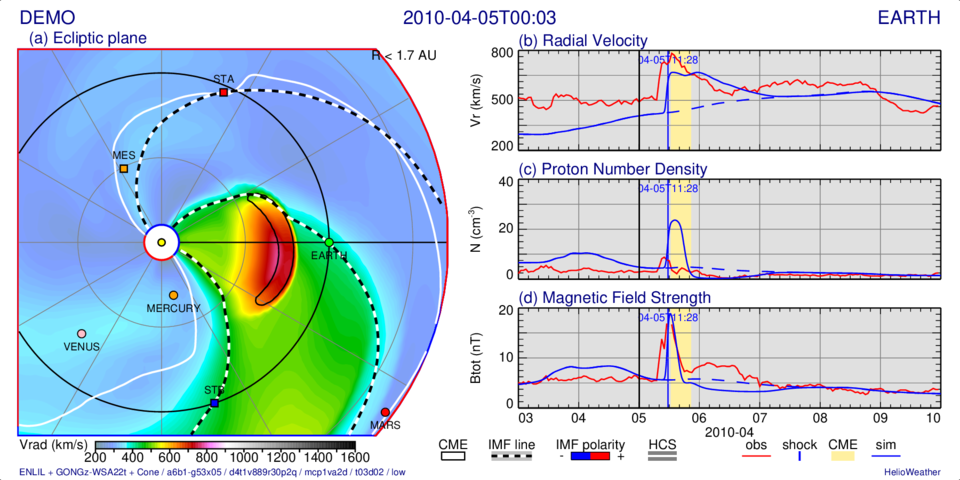
Options: -namevo [“vr”,“den”,“btot”] -namobs “earth” -namslc “vrad1” -zoom 1
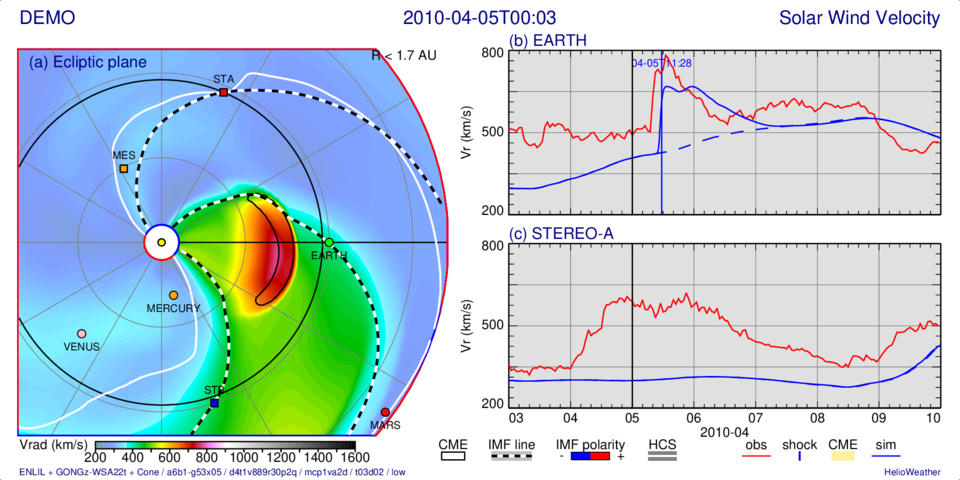
Options: -namobs [“earth”,“stereoa”,“stereob”] -namslc “vrad” -zoom 1
Options: -namevo [“vr”,“den”,“btot”] -namobs “earth” -namslc “vrad1” -zoom 1
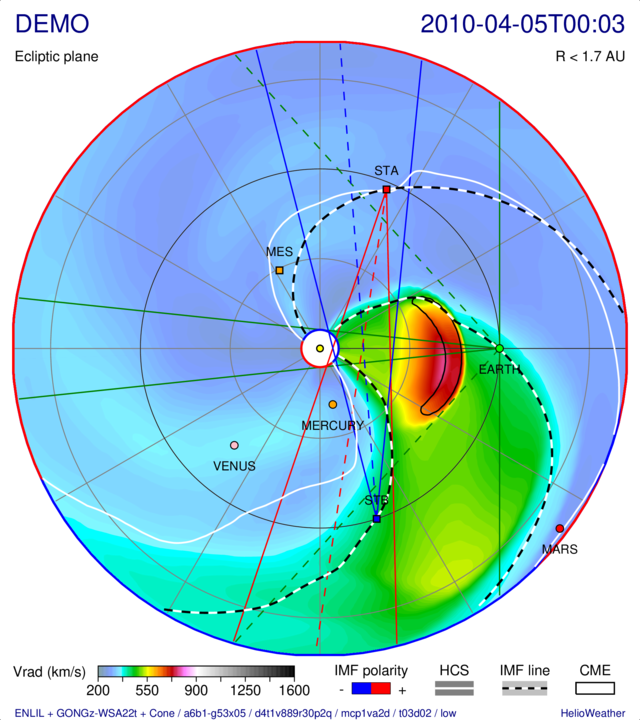
Options: -namobs “earth” -namslc “vrad1” -zoom 1
Options: -namobs “earth” -namslc “vrad1” -zoom 1
Options: -namobs “earth” -namslc “vrad1” -zoom 1